Significant slowdown after 0.12 migration & CodePoints on large forms (midsize Halogen app)

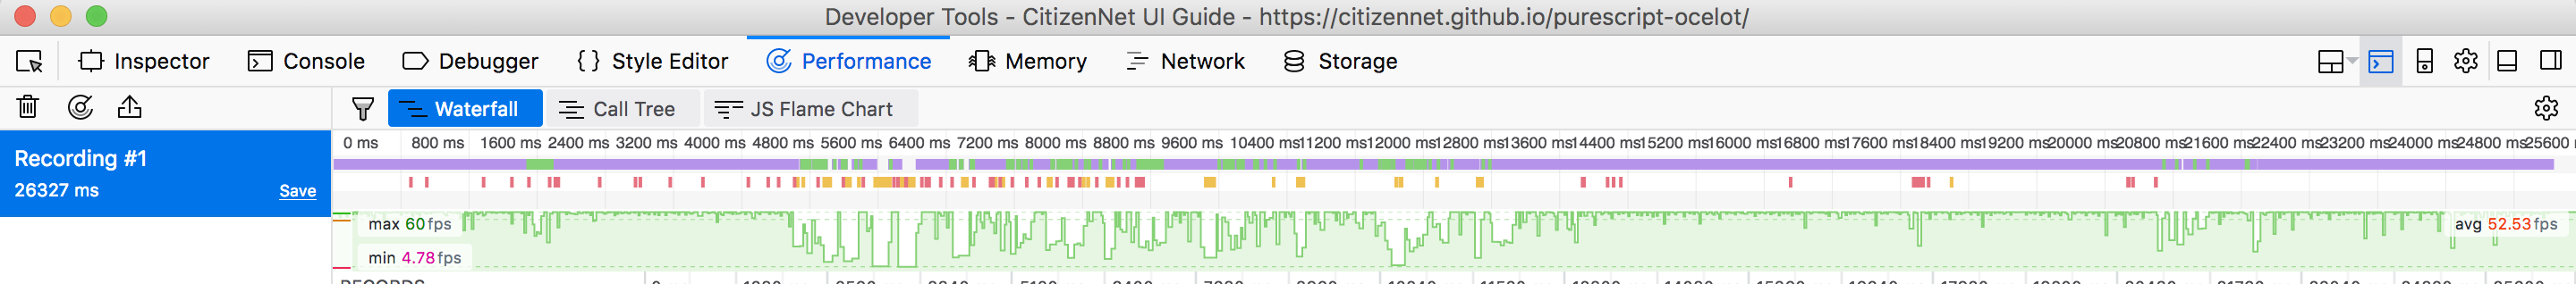
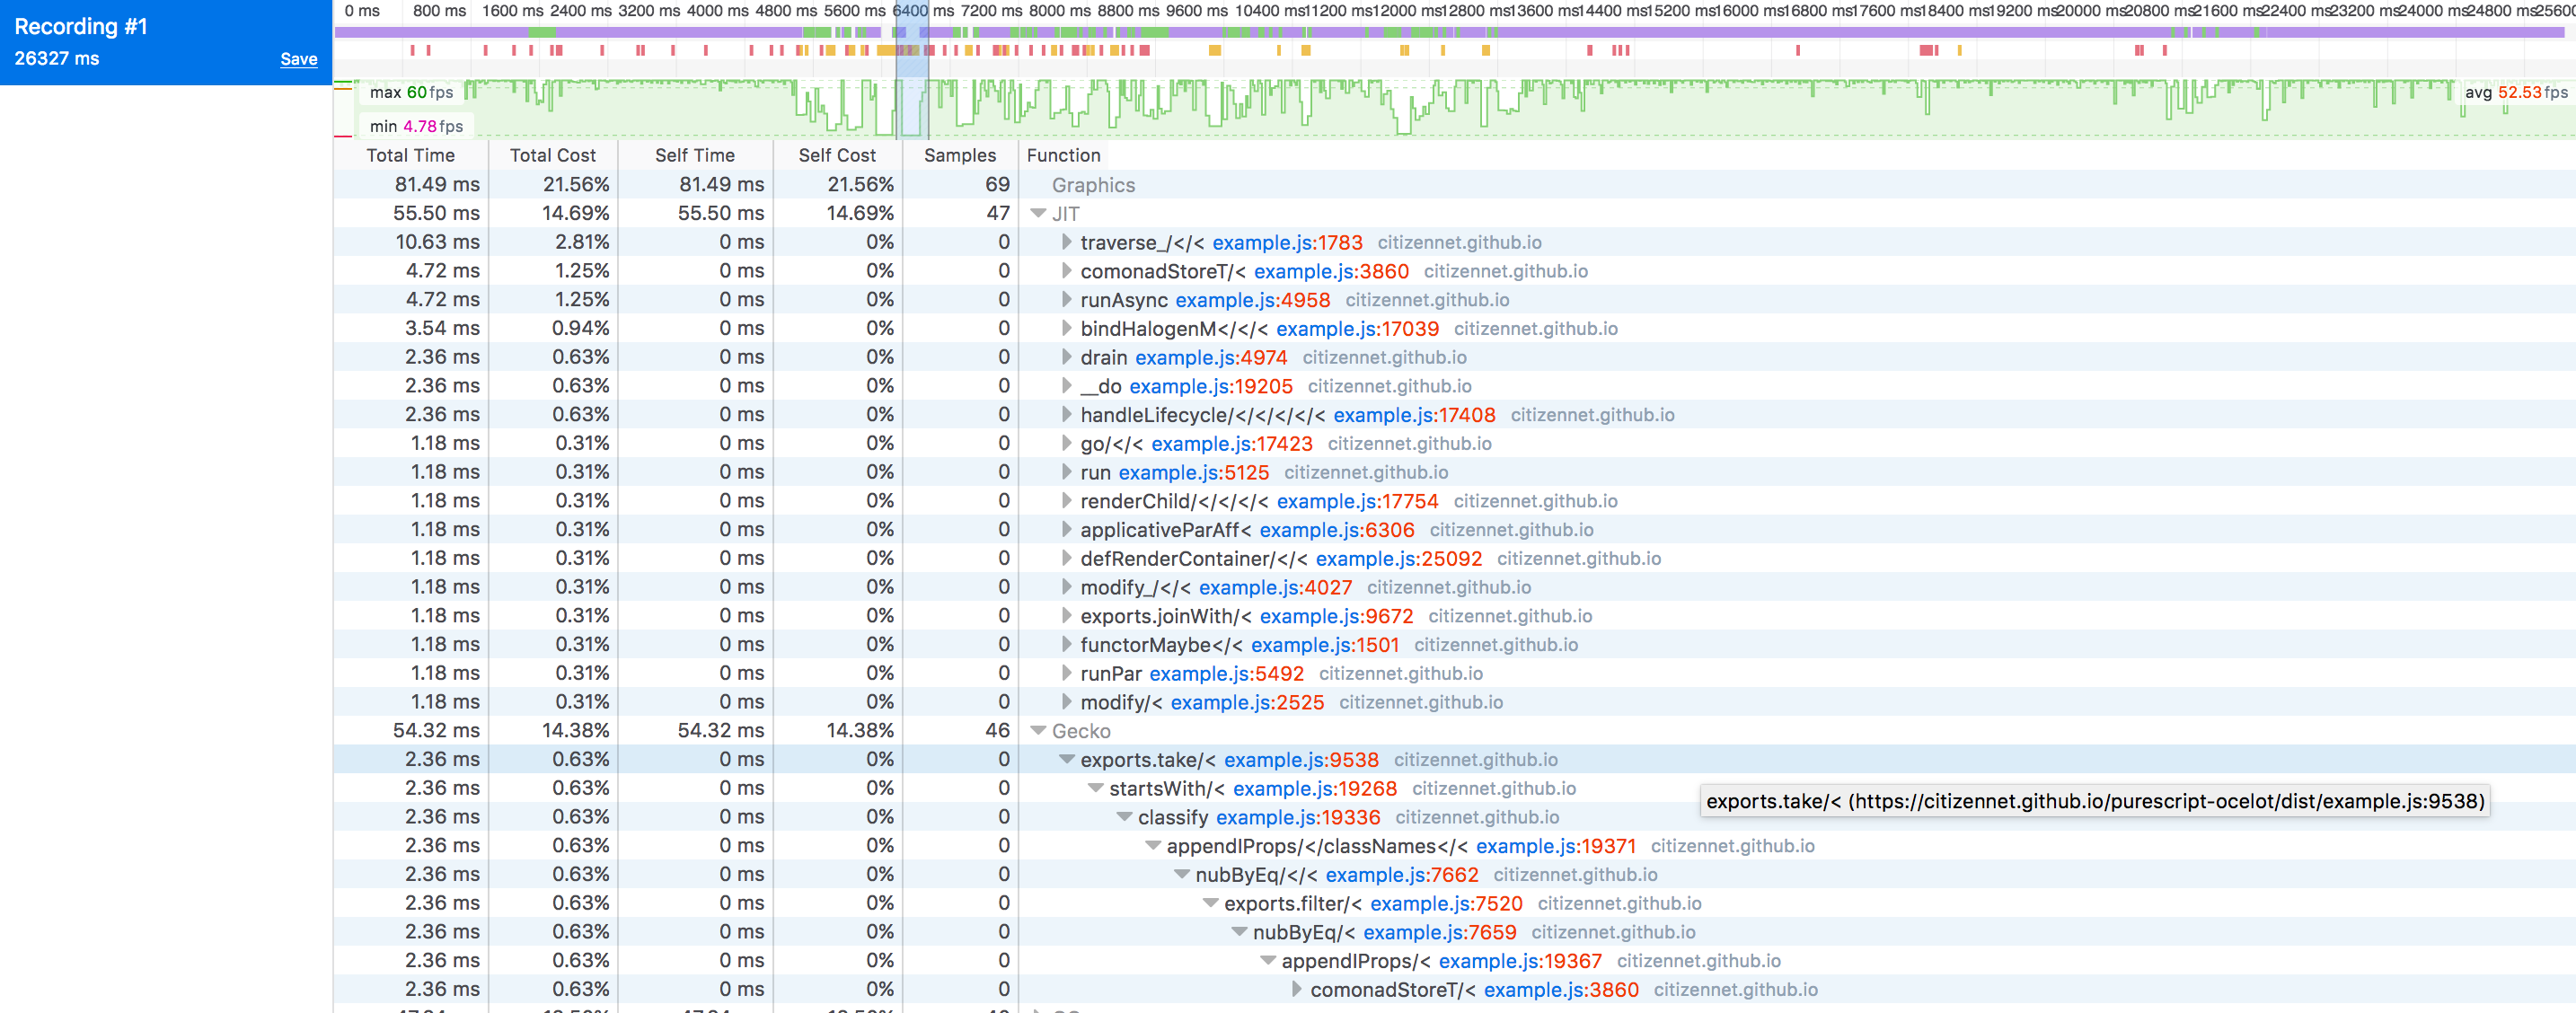
Update: it turns out the root of the problem was switching to code points instead of code units for string functions, coupled with a terribly inefficient function that was causing major VDOM redraws. Lessons:

  • browser profiling is your friend
  • use code points for correctness, but know they are extremely slow, so use code units for performance as needed

We have a large Halogen application in production. Most of the pages involved are pretty simple, but we have a few large, complex forms. The forms have a few dozen fields and some of them are fairly complex typeaheads, calendar pickers, and so on, while most of them are text fields.

Usually these large forms render out quickly and register updates instantly. However, weā€™ve just migrated the application to 0.12 and thatā€™s no longer true. The input fields have become laggy, the typeaheads take a while to respond and open, even animations and cursors are sluggish.

This has been a surprise because we changed no logic in the transition ā€“ we just changed imports around, deleted effect rows, and so on. The only places where functions changed was in using liftEffect or identity instead of their previous names.

Has anyone else experienced something like this after migrating a Halogen application to 0.12?

Troubleshooting

Weā€™ve taken a few steps to check whatā€™s going on.

  • We verified that this code pre-0.12 worked properly (no lagginess)
  • We verified we havenā€™t changed the underlying logic, just changed types and a few function names
  • We verified that other, smaller pages do not have this same problem
  • We verified that the form speeds up more and more the more fields we delete from it, until with a handful of fields it is snappy and responsive again

Possibilities

I canā€™t see how our code changes would have slowed this form down so dramatically, so Iā€™ve turned to look at our dependencies to see whatā€™s changed there. Perhaps we wrote horribly inefficient code in the first place and that problem is only being revealed now, or perhaps a dependency has become inefficient when it wasnā€™t before, but either way if the problem isnā€™t in our code then we ought to turn to dependencies and see if somethingā€™s happened there.

Things that come to mind:

  • Perhaps something that was previously stack-safe is now gobbling up memory in our code?
  • Perhaps something has changed in the VDOM implementation under the hood?
  • Perhaps some dependency of Halogen has become less efficient?

I havenā€™t yet had the time to do it, but Iā€™d like to play around with a 0.12 Halogen project with some large pages and see if the issue is specific to our code base or if it affects all Halogen projects.

Related Questions

This is the first time Iā€™ve needed to debug performance problems in a PureScript application and more specifically a Halogen application. Iā€™m actually not so sure where to start analyzing to try and find a root cause.

Does anyone have pointers for drilling down into performance problems to start identifying some possible solutions?

Dependencies

    "purescript-prelude": "^4.0.1",
    "purescript-console": "^4.1.0",
    "purescript-halogen": "^4.0.0",
    "purescript-affjax": "^6.0.0",
    "purescript-datetime": "^4.0.0",
    "purescript-argonaut": "^4.0.1",
    "purescript-formatters": "^4.0.0",
    "purescript-generics-rep": "^6.0.0",
    "purescript-newtype": "^3.0.0",
    "purescript-css": "^4.0.0",
    "purescript-remotedata": "^4.0.0",
    "purescript-parallel": "^4.0.0",
    "purescript-routing": "^8.0.0",
    "purescript-read": "^1.0.1",
    "purescript-record": "^1.0.0",
    "purescript-profunctor-lenses": "^4.0.0",
    "purescript-behaviors": "^7.0.0",
    "purescript-email-validate": "^3.0.0",
    "purescript-bigints": "^4.0.0",
    "purescript-numbers": "^6.0.0",
    "purescript-halogen-css": "^8.0.0"
3 Likes

Could you try swapping your halogen dependency for garyb/purescript-halogen#minimal-vdom-updates?

Halogen was barely changed in the 0.12 update, but Nate updated halogen-vdom to take advantage of EffectFn inliningā€¦ maybe that was as a de-optimisation, for reasons that arenā€™t obvious, as it seems like it should be only beneficial.

This new branch is a version of halogen-vdom that doesnā€™t do this, and is just minimally updated from the 0.11 release instead.

If the vdom thing doesnā€™t do it, narrowing down the problem is probably going to get tricky. Using the browser to capture profiles is the usual way we dig into memory and performance issues.

2 Likes

After some profiling, this is self induced. Those code points tho. :sweat_smile:

2 Likes

@garyb Thank you for putting together that minimal example branch! It looks like @foresttoney beat me to the solution before I had time to run through this but I appreciate you taking the time to do that.

I am really surprised to see such an impact from the code points and I want to dig in to that further. I think Forest has some nice performance measurements he used to pinpoint the issue that might be useful to the community generally. I saw that @justinw noticed something like a 100x slowdown on string-parsers when they used code points under the hood and thatā€™s just exceptionally bad.

I havenā€™t looked at all at how code points work / are implemented, but Iā€™m not sure theyā€™re acceptable as a default in PureScript if the performance is this bad.

1 Like

For the issue with code points in string parsers, it seems like what should happen is to make the current string-parsers library code-units based and for someone to make a new library that works directly with the code points representation without trying to constantly convert back and forth between it and JS String. But it doesnā€™t seem like many people are even using this string parsers library, especially with people preferring to roll their own solutions for their given problems (maybe Iā€™ll become one of those people or make my own minimal library at some point).

1 Like

As Thomas has already noted, the issue he initially described is not related to our v0.12 migration. The initial profiling indicated that our use of code points was significantly slowing down certain views in our application. While that was true, we still have a significant performance problem. There might be several issues here, but I believe the problem is in the pure functions we call blocks found in purescript-ocelot.

Blocks, for the most part, are Halogen HTML DSL functions with some styling applied. They look something like this.

buttonClasses :: Array HH.ClassName
buttonClasses = HH.ClassName <$>
  [ "bg-blue"
  , "p-5"
  , "text-grey"
  ]

button
  :: forall p i
   . Array (HH.IProp HTMLbutton i)
  -> Array (HH.HTML p i)
  -> HH.HTML p i
 button iprops =
   ( [ HP.classes buttonClasses ] `appendIProps` iprops )

You can find the definition of appendIProps here, but it allows us to specify classes external to the block definition. For example:

Button.button
  [ HP.class_ (HH.ClassName "ml-5") ]
  [ HH.text "Create" ]

I believe this is where the problem is. This computation is being done for each block on every render. Given a large view, this creates significant performance problems.

You donā€™t need to construct a large view to reproduce the problem. Here is a simple view from the UI-Guide found in purescript-ocelot. If you do some clicking around while profiling you will see something like this:

Every render, you see the frame rate dipping or bottoming out. If you take a slice where the frame rates drop, you will see something like this:

If you inspect the call tree you notice a lot of time is spent in appendIprops and related functions. In this case, you also see the purescript-select's use of a comonad to allow for re-rendering via the supplied render function.

The problem is exacerbated in a large view. When we start rendering hundreds of blocks in a view, the app crawls.

Aside from not performing the computations on each render (a la scrap appendIProps) I am not sure how to improve the performance. Yesterday we tried to use purescript-memoize to see if we could eliminate recalculations, but IProp does not have an instance of Tabulate and what parts we were able to memoize made the problem worse.

Any thoughts?

If you want to improve performance, the only thing to really do is perform less work. If appendIProps is a huge cost center, then I would see if I could do away with it. If I were making something similar to the block interface, I would make no assumptions about which classes are the ā€œdefaultā€. Generally, I consider HTML/Props to be opaque, in that I would not design an interface that assumes Iā€™m going to open it back up and rewrite it (aside from the Bifunctor/Functor interface). In your implementation you are even using unsafeCoerce because the representation is opaque for PropValue.

Right now, because you make assumptions about default classes, you are paying the cost of appendIProps pervasively. If you instead remove that from your block structure and expect the user to pass in all classes all the time, then the burden is shifted to the user to specify if they even want to deal with defaults. You can then export the default class list, and the user can choose to use that or not. They can also choose to derive their own static list based on the defaults and reuse that. Optimization at that point is in the hands of the user, and not in your block structure.

2 Likes